
A repost from the our 3-part blog series that we published on Colab Radio through a collaboration with MIT Community Innovators Lab. This post #2 features Steven’s investigation of our sonic data. You can read post #1.
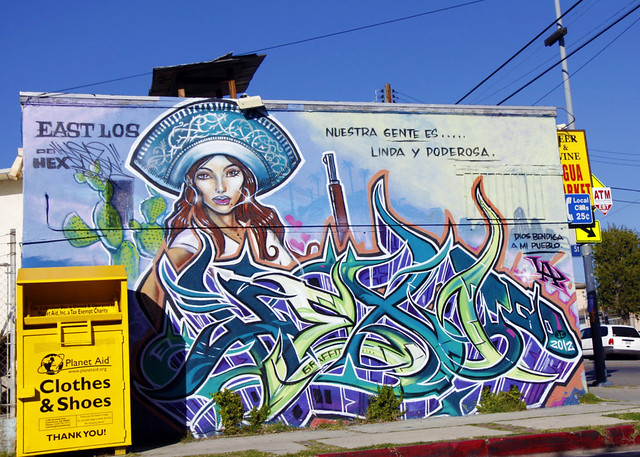
Boyle Heights Mural. Photo Credit: jondoeforty1.
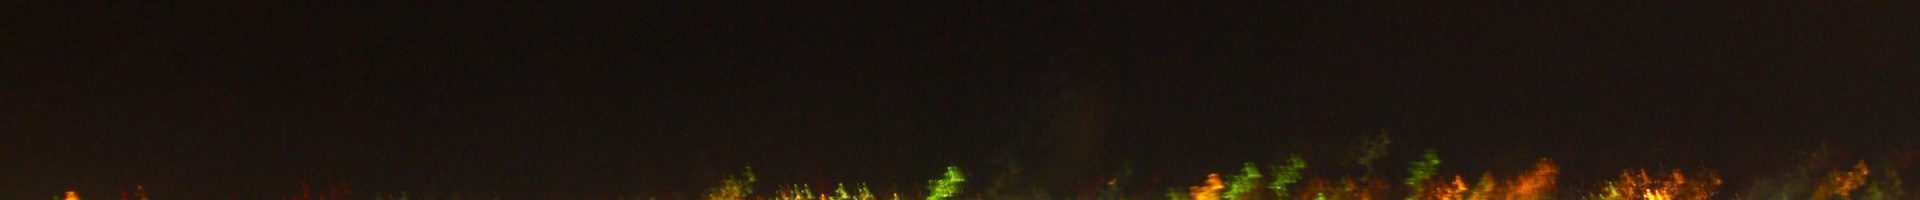
Standing at the intersection between East Cesar E Chavez Avenue and Chicago Street in Boyle Heights, I can hear many sounds unique to this neighborhood. Mariachi musicians playing bass on the street, recorded music coming from stores, and the sounds of people talking as they walk along the sidewalk. By far the most dominant sound is that of the passing vehicular traffic. Sounds of passing vehicles provide a semi-regular, underlying rhythm to the overall aural experience of the place. There are moments of dense vehicular activity and moments in which traffic ebbs and flows. In this second post of our blog series on LA Listens, I discuss the rhythm of vehicular traffic sounds by examining the following excerpt from our 19-minute field recording of Boyle Heights:
Measuring the Sound of Passing Vehicles
By understanding the periodicity of traffic noise, we can uncover the rhythmic aspects of the sonic experiences of this location. In order to identify the sonic qualities of passing vehicles, I’ve taken a two-pronged approach of listening to the sound and visualizing it in a sonogram (sound spectrogram)—a plot of the frequency information of a sound over time. I’ve used the Raven Interactive Sound Analysis software developed by the Cornell Lab of Ornithology Bioacoustics Research, to help identify and analyze the changing patterns in vehicular traffic sounds.
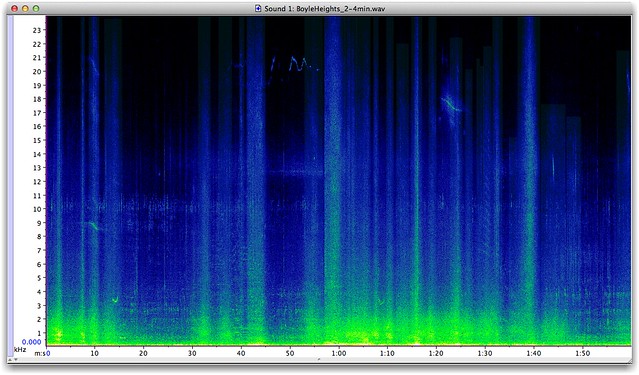 Sonogram of our 2 minute sample
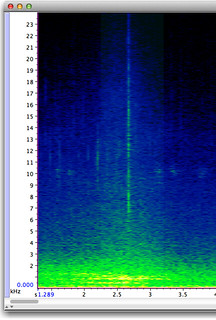
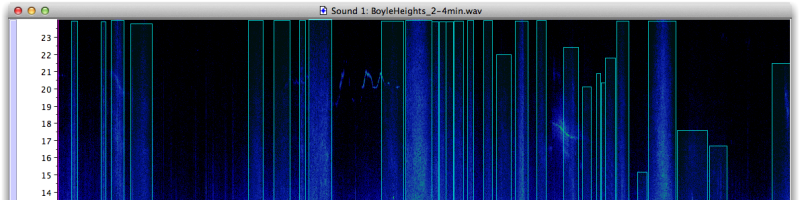
Sonogram of a Vehicle Passing
In the same way that light is made up of component colors (wavelengths) of the visible spectrum, which can be viewed individually by using a prism, sound is made up of combinations of individual frequency components ranging from low to high. Like a prism, a sonogram allows us to see all of the individual components that make a sound, representing three dimensions of data: time, individual frequency components of sound, and the loudness (power) of those frequency components. The horizontal axis represents time (in seconds), the vertical axis represents the frequency range of the sound (in kHz), and the colors represent the loudness of each frequency component. For reference, this site from Columbia University provides a more detailed explanation of sound and loudness.
Sounds of a vehicle driving generally consist of the sound from the engine, tires on the pavement, and wind. This group of sounds take up virtually the entire frequency spectrum, and fades in and out as the vehicle passes the recording position. Louder frequency components are represented by a brighter color, i.e. neon green in the above example. I extracted the above sonogram from our field recording. The vertical line in neon green indicates a moment when a vehicle passes our recording site. The visual form of the sounds of individual passing vehicles becomes identifiable after listening to these sounds while looking at the sonogram.
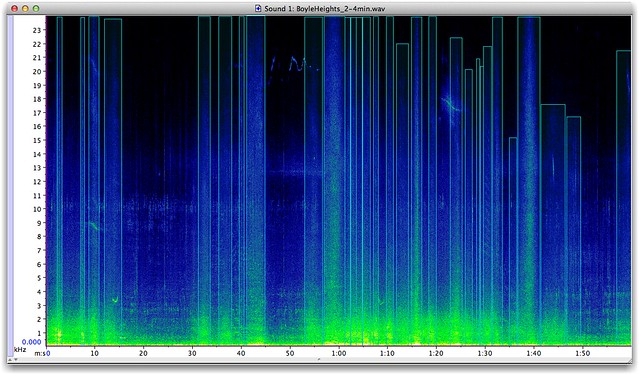 30 events of passing vehicles were detected in the recording
Raven provides information about each passing vehicle’s timing and duration. I used Raven to isolate passing vehicles as sonic events. Analysis of the recording shows 30 instances of passing vehicles. The unit of comparison indicated in the chart below is a single sound event, the duration of either a single passing vehicle, or multiple vehicles without a discernable break between them.
| Sound of Passing Vehicles | Time (seconds) |
|---|---|
| Average duration | 2.2 |
| Median duration | 1.84 |
| Minimum duration | .59 |
| Maximum duration | 5.01 |
| Total time of vehicle sounds | 65.9 |
| Percentage total time vehicle sounds | 55 |
This analysis nuances our understanding of the sensory experience of the streets. It tells us how much our aural experience is dominated by sounds of vehicular traffic. In this 2-minute recording, over half of our time (55%) is spent listening to passing cars! Additionally, the duration value of passing vehicles can provide a point of reference for the rate at which the vehicular traffic flows. This information may be useful for urban planners and organizers to understand the impact of street infrastructures like traffic signals on pedestrians and cyclists especially as they consider design elements related to safety, flow, and street intersections.
Speculating a Vehicle-free Neighborhood
Knowing that our aural experience is dominated by vehicular traffic sounds, I decided to make a vehicle-free version of our 19-minute field recording by removing all moments that include vehicular traffic sounds. For the sake of continuity, I left out moments between vehicles that were shorter than 3 seconds. The resulting recording is only 2:37 long, which demonstrates just how prevalent vehicular noise is in the neighborhood.
Through this recording, we can imagine a sonic landscape of the streets in Boyle Heights absent of the sounds of cars, buses, trucks, and motorcycles constantly passing by. (Air traffic, including planes and helicopters has not been removed). This virtual soundscape provides a model for an augmented reality app that I would eventually like to create–one that removes the sound of traffic in real time.
Preview of Blog Post #3
In the next and final post of our blog post series, Wendy will take us through a soundwalk with a community expert through Boyle Heights, to explore the political and economic significance of neighborhoods sounds in social contexts.
Post by Steven Kemper, a composer of acoustic and electroacoustic music and a music technologist who focuses on interactive technologies and robotics.
Pingback: A sound walk through the changing street economy of Boyle Heights – LA Listens